Get started with Plotly Dash: a COVID19 dashboard for Tunisia
By Iyed Ghedamsi
May 2, 2020
Can you create a pretty and usable dashboard without knowing much about frontend development ?
Various attempts at making the answer to this question a YES have been made with varying degrees of success.
Probably the most famous attempts are tools like PowerBI Microsoft or Tableau which have a relatively low barrier to entry compared to solutions that involve coding.
Even the omnipresent (but far form omnipotent) Excel could be used as a dashboarding tool.
But that comes at a cost of lower customizability / extensibility.
It goes without saying that using these solutions for commercial uses
cost vastly more despite having very usable versions for users who wish
to try the tools.
In this tutorial we will focus on Dash by Plotly, the creators of the eponymous plotting library. Keep in mind, however, that the python ecosystem offers a variety of tools with various tradeoffs and considerations. None of these solutions is a cure-all, therefore it is wise to keep an open mind and tinker with some of them (all of them ?).
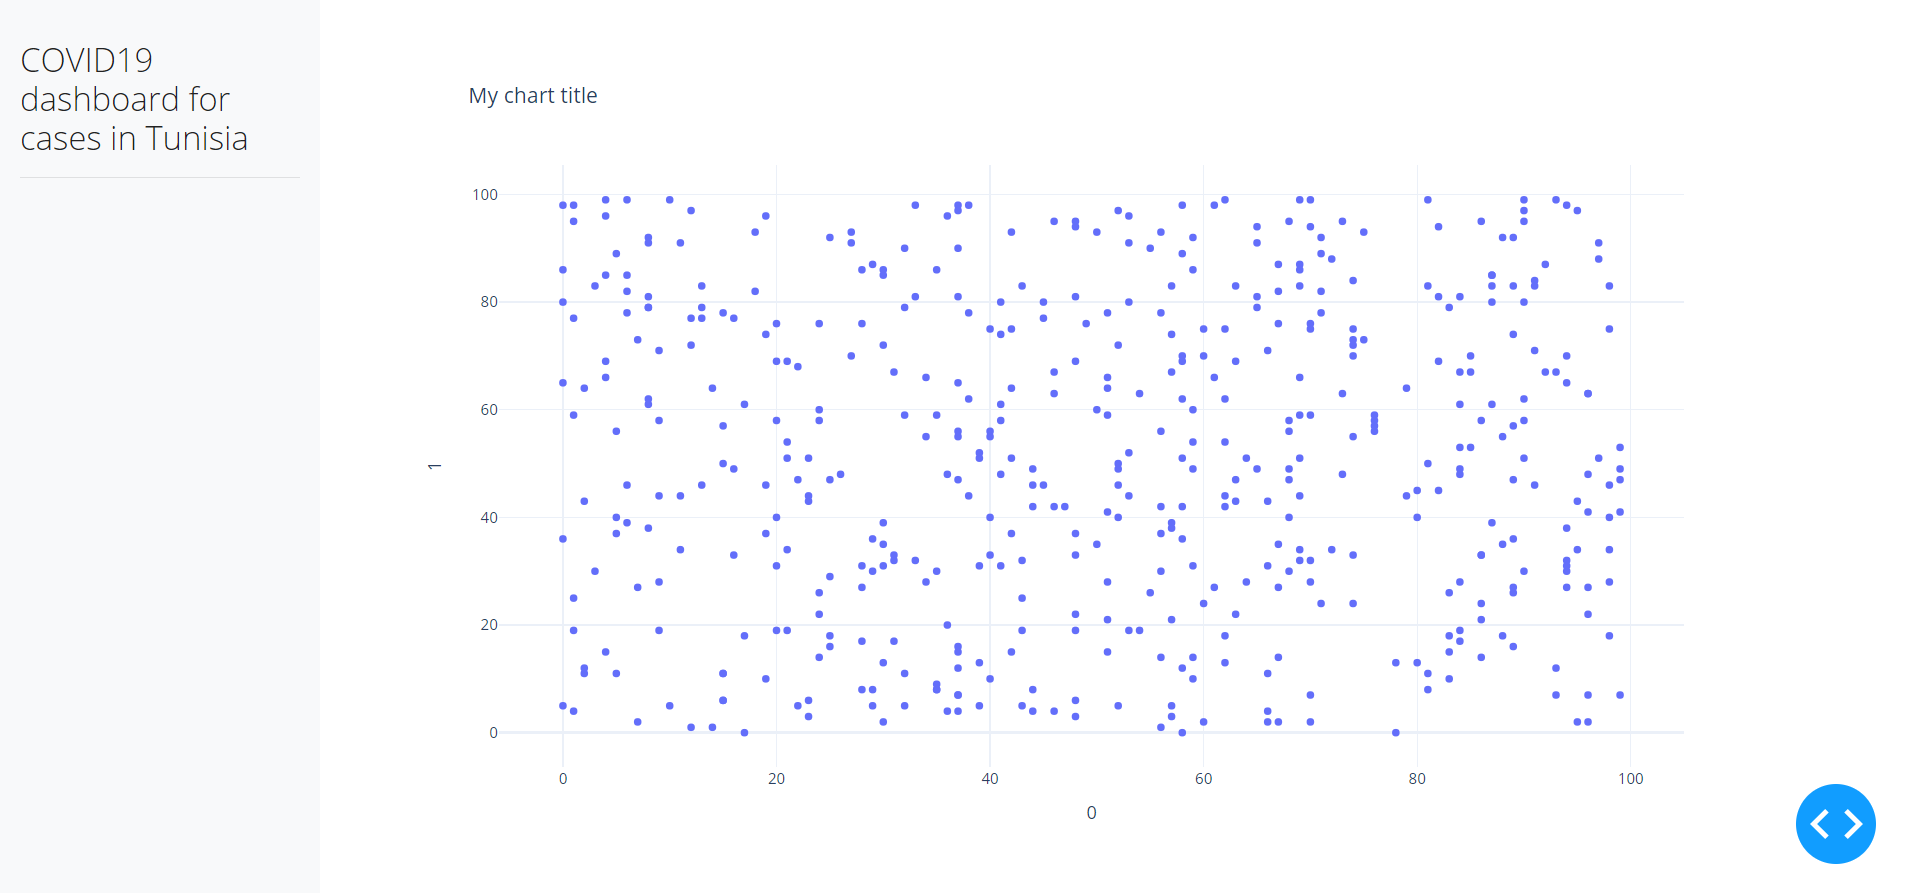
By the end of this tutorial we will have a dashboard that looks like this:
Elements of a Plotly Dash project
It is important before we start building our dashboard that we understand some concepts driving Dash. The first idea we will touch on is reactive programming.
Reactivity and Callbacks
Even if you don’t know what reactive programming means you’ve most likely used it in … Excel.
In Excel, when we use a formula to compute the sum of two cells, as soon as a value in the summation changes, the formula cell recomputes its value in reaction.
The equivalent idea to an Excel formula for Dash is a callback function.
|
|
In the highlighted lines 1-4, we are saying that the attribute value of an object with and ID of output-cell should react to
changes in the value attribute of the objects with ID cell-1 and cell-2.
|
|
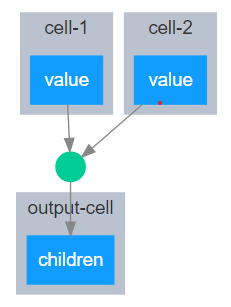
Callbacks diagram
In the function definition we describe how the value attribute of output-cell should react
to a change in the value attribute of cell-1 and / or cell-2.
In our case that would be to return the sum of the values.
It is not important to focus on the syntax for now,
we are simply building a conceptual model of how Dash works.
One question that arises from the snippet we have just seen is what are output-cell, cell-1 and cell-2 ?
Layout
To continue our Excel simile, let us think of an Excel cell as a special kind of user interface components.
In essence, a cell in a spredsheet is not that much different from an input box, a checkbox, or a dropdown list.
These user interface elements can hold various attributes of their own, including a value attribute,
and allow the user to trigger callbacks which ultimately allows our dashboard to react to user input.
|
|
With the addition of a layout as described in the lines 8 through 14, our dashboard can now display a user interface, and react to changes triggered by user input. Running the code above results in the following “dashboard”
Getting our hands dirty
Virtual environment and dependencies installation
For this project we will need to install the following dependencies:
- dash is the library that will provide two components for our project: the dashboarding and the plotting through
plotly-expresswhich we will introduce as we go. - dash-bootstrap-components will allow us to theme our app using Bootstrap which provides useful layout capabilities and interesting components. For this tutorial we will limit ourselves to using the Grid
- pandas which we will use for the data manipulation part.
- geopandas will be of use when plotting data on a map.
- pyprojroot is a small utility library that allows us to reference files inside our project using paths relative the root of our project instead of absolute long paths.
You can install them using the following command
pip install dash==1.11.0 dash-bootstrap-components pandas geopandas requests pyprojroot
It is recommended that you create a virtual environment for your project. That can be done easily (assuming you’re running a Unix based system):
md covid_dash
cd covid_dash
python -m venv .venv
source .venv/bin/activate
Directory structure
The directory structure that we will need looks as follows
.
├── data
│  └── raw
└── src
   ├── __init__.py
   ├── app.py
   ├── callbacks.py
   ├── cli.py
   ├── data.py
   ├── index.py
   ├── layouts.py
   └── plots.py
To create it you can run the following commands
md -p plotly_dash_tutorial/{data/raw,src}
cd plotly_dash_tutorial
touch src/__init__.py # Making a python package named src
touch src/{app.py,index.py} # General application / dashboard code
touch src/{callbacks.py,layouts.py} # Plotly dash specific code
touch src/{plots.py,data.py} # The model part of our application
Application setup
To setup our app, we need to create an app object.
This object is central to our application in the sense that it acts as the
orchestrator of the interaction between our layout components through the callbacks we define.
In addition to creating a Dash app object, we pass style information through
the external_stylesheets key word.
app.py
|
|
index.py will act as the entry point to our dashboard. The lines 7-8 allow
python to call the run_server method from our Dash app object if index.py
is called from the command line. The key word debug provides us with
autoreload and more expressive UI side error, therefore when developing a
dashboard it is recommended that it be set to True.
You may notice that we’ve only used two of our imports in the body of
index.py. We used the app to start a server for our dashboard, and use the
layout import to attach it to our app object, what about callbacks ? One may
be inclined to remove the line importing callbacks but that would mean that
our app will not have access to any logic we define in our callbacks.
index.py
|
|
Creating the layout
layouts.py
|
|
Let’s begin by discussing the imported modules for layouts.py.
dash_bootstrap_components, dash_core_components and dash_html_components
contain components which correspond to HTML elements. These are what largely
liberates the developers from actually writing HTML, CSS which are responsible
for the View layer of our dashboard. The components provided by these modules
can vary in complexity from being a mere text container such as html.H1 to a
full interactive table such as dcc.DataTable. It is generally useful to keep
the documentation from theses modules open in a side tab while creating the
dashboard.
The general layout of our page is composed of two major containers, a sidebar and a main content area.
Base layout
Our main container uses the self-descriptive component bcc.Container.
It is, however, important that we understand that despite this component
and similar layout components, do not translate directly into visible elements
on our page, they modify the position of elements on the page. In
addition, the Container component comes with the added benefit of adding
responsivity to our page thanks to being based on Bootstrap, which further
improves the usability of our dashboard.
As a rule of thumb, components from dash_html_components
correspond to HTML elements, and they are named as such.
For instance, an h1 element in raw HTML corresponds to html.H1 (notice the
capitalization). By contrast, components from dash_core_components contain
components with interactivity baked into them such as tabs, dropdown lists and
data tables.
layouts.py
SIDEBAR_STYLE = {
    "position": "fixed",
    "top": 0,
    "left": 0,
    "bottom": 0,
    "width": "18rem",
    "padding": "2rem 1rem",
    "background-color": "#f8f9fa",
}

MAIN_CONTAINER_STYLE = {
    "margin-left": "18rem",
    "margin-right": "2rem",
    "padding": "2rem 1rem",
    "height": "100vh",
}

sidebar = html.Div(
    [
        html.H3("COVID19 dashboard for cases in Tunisia"),
        html.Hr(),
    ],
    style=SIDEBAR_STYLE,
)

main_container = dbc.Container(
    [
        dcc.Loading(
            dcc.Graph(
                id="main_graph",
                figure=figure,
            )
        ),
    ],
    style=MAIN_CONTAINER_STYLE,
    id="main_container",
)

layout = dbc.Container([sidebar, main_container], fluid=True)
As for the dictionaries SIDEBAR_STYLE and MAIN_CONTENT_STYLE they are used
to show that there are multiple ways to define the style and layout of our
components. In both cases, we must provide valid CSS rules. Dictionaries of
style may be useful when we have a style rule specific to a component or simply
as a shorthand for writing an external CSS stylesheet.
It is also worth noting that we must assign and id to each component we will
interact with later on in our callbacks.
layouts.py
id="main_container"
Finally, we define our root container and simply set sidebar and
main_container as its children.
Now we will go over the specific components that we will use in this dashboard:
dcc.RadioItems
Radio Items are generally used in groups where the user must choose exactly one
option, and must choose an option. To this end, we will use the dcc.RadioItems
component to get let the user choose the data view they want displayd in the
main container area of our page. We will have three options:
- Map view
- Line chart view
- Bar race chart view
To implement this use case in Dash, we write the following code:
layouts.py
view_selector = html.Div(
    [
        html.H4("Dashboard view"),
        dcc.RadioItems(
            id="content_view_selector",
            options=[
                {"label": "Map view", "value": "map"},
                {"label": "Line chart view", "value": "line"},
                {"label": "Bar race chart view", "value": "bar_race"},
            ],
            value="map",
            labelStyle={"display": "block"},
        ),
    ]
)
Essentially, the RadioItems components takes a list of dictionaries as
options. Each dictionary must have at least the two keys label and value.
The label of the option is the text that will be shown on the user interface,
while value is a corresponding alias that we use internally in our code, which
means it is possible to have the label and the value be the same string. The
value key word provides the default value of our component.
As we mentioned before, since we will be interacting with this component, we
must give it an id, content_view_selector in this specific case.
dcc.Dropdown
Dropdown lists are very similar to a Radio Items group in that they allow the user to pick choice(s) from a list of possible options. The difference, despite being subtle, is rather important: Dropdown lists may allow a user to pick more than one choice. In addition, on a user experience level, dropdown lists are usually reserved for longer lists of options as a means to declutter our interface. In our specific case we could have used another Radio Items group but the dropdown list is used merely to illustrate another component.
Notice that in this instance we assign the options keys label and value the
same text out of a list of possible choices by_gov_indicators. This pattern
can be useful when the text to display and the internal value used in the code
do not differ.
We set the key word clearable to False to force the component to always have a
value that is not NULL.
layouts.py
indicator_selector = html.Div(
    [
        html.H4("Indicator"),
        dcc.Dropdown(
            id="indicator_selector",
            options=[
                {"label": indicator, "value": indicator}
                for indicator in by_gov_indicators
            ],
            value=by_gov_indicators[0],
            clearable=False,
        ),
    ]
)
dcc.Graph
Now we address the most important component of our Dashboard, in terms of real
estate on the screen and in terms of value: the dcc.Graph.
layouts.py
dcc.Graph(
    id="main_graph",
    figure=figure,
)
That’s it !
The graph component does not take any fiddling around. In the general case we
will just provide it with a Figure object from plotly.express or
plotly.graph_objects or even nested python dictionaries describing the figure.
Now our Interface should look somehting like this:
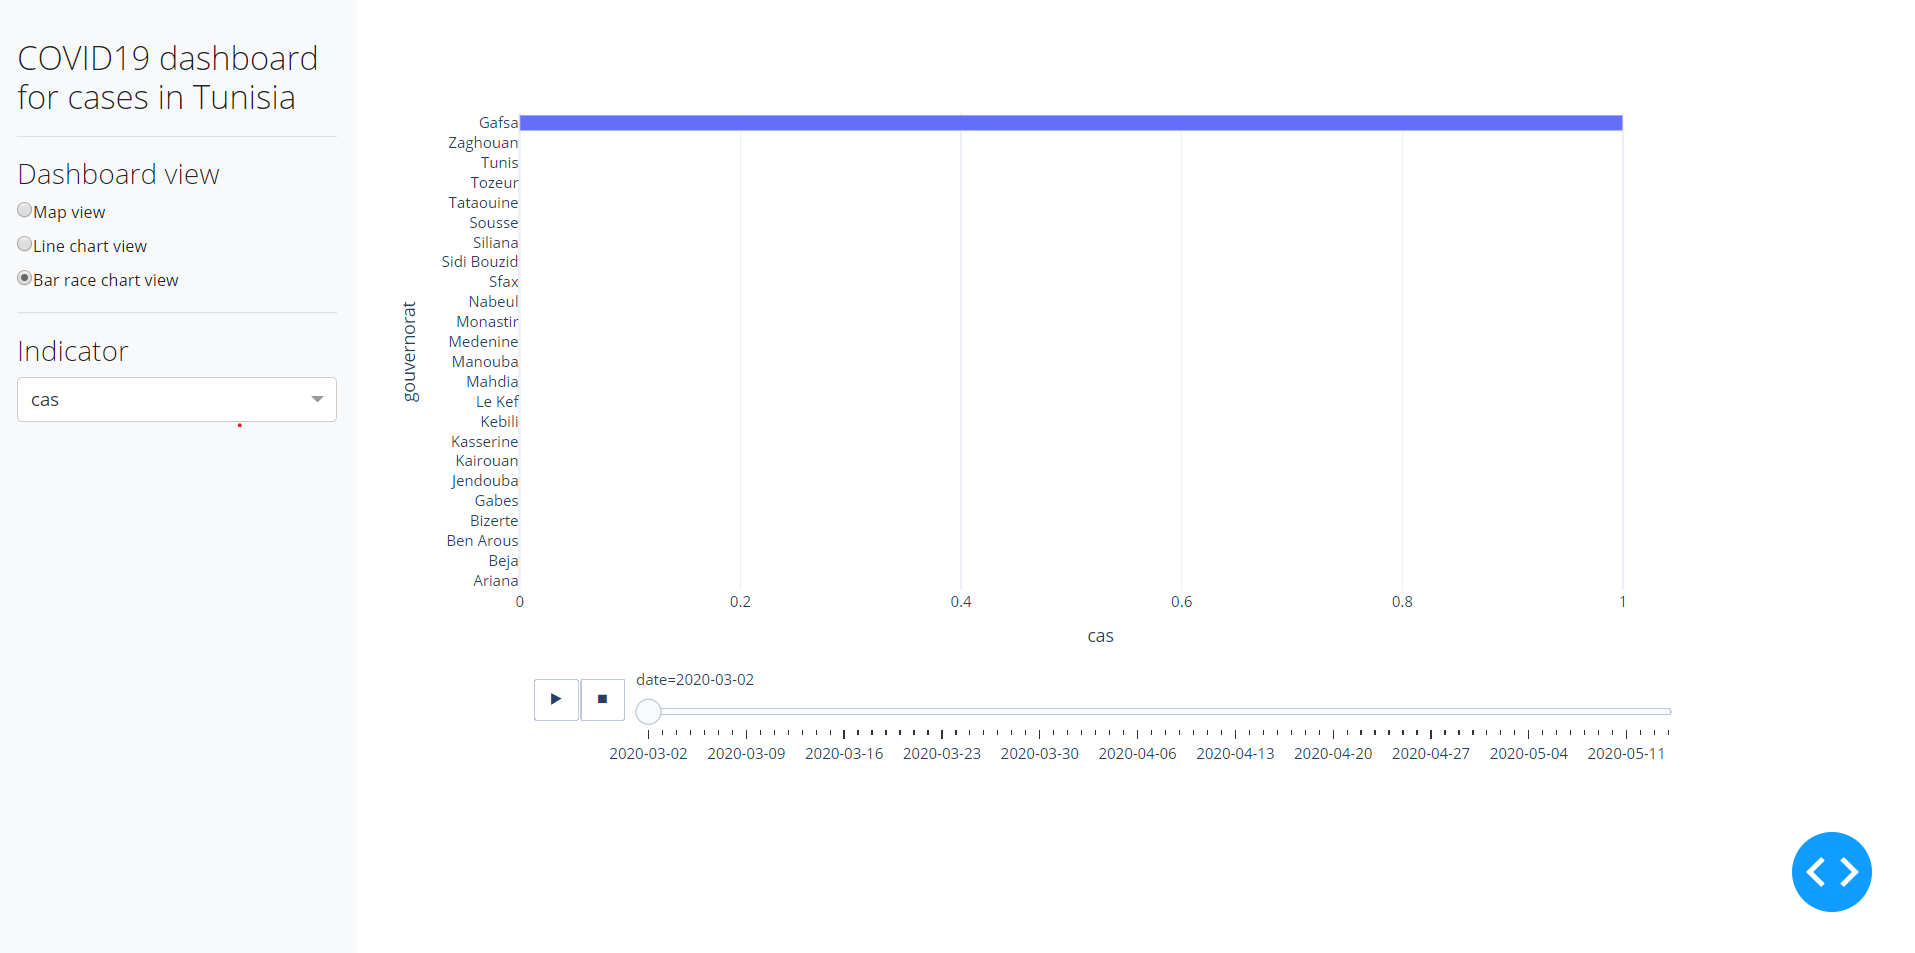
Finished layout
Callbacks: reacting to user input
If we were to run our dashboard as it is now, we would be greeted with a well laid out set of components on a page that do nothing. The missing ingredient is callbacks.
callbacks.py
from dash.dependencies import Input, Output
from .app import app

from .plots import (
    plot_daily_cumulative_active_cases,
    plot_part_of_daily_active_cases,
    plot_race_plot_of_cumulative_daily_active_cases,
)
from .data import geo_targa_covid_df


@app.callback(
    Output("main_graph", "figure"),
    [Input("content_view_selector", "value"), Input("indicator_selector", "value")],
)
def update_main_content(view, indicator):
    if view == "map" or view is None:
        return plot_part_of_daily_active_cases(geo_targa_covid_df, indicator)
    elif view == "line":
        return plot_daily_cumulative_active_cases(geo_targa_covid_df, indicator)
    else:
        return plot_race_plot_of_cumulative_daily_active_cases(
            geo_targa_covid_df, indicator
        )
As can be seen, callbacks.py does not contain much code, so let us dissect it
bit by bit.
callbacks.py
|
|
In the first line, we import Input and Output which are functions that allow
us to define the direction of the flow of information in our app. Then we import
the app object as it will be used to define the callback functions later.
Input and Output have a similar function signature; both of them take two
arguments: component_id and component_property. These information allow Dash
to build a dependency tree between the various properties of the components that
we use in our callbacks. In our case, when we set the Output of our callback
function update_main_content to the figure property of main_graph, we are
describing a flow of information from the inputs of our callback function: the
value property of content_view_selector and indicator_selector, through
the body of our callback function where we transform and / or augment the values
we’ve received, and returing the information that changes the figure property
of main_graph.
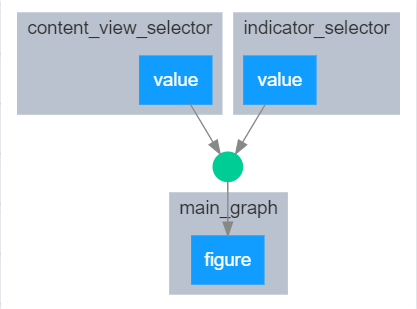
Final dashboard callback chain
To understand the specific flow in information in our callback, let us look back at the main body of the callback function:
callbacks.py
@app.callback(
    Output("main_graph", "figure"),
    [Input("content_view_selector", "value"), Input("indicator_selector", "value")],
)
def update_main_content(view, indicator):
    if view == "map" or view is None:
        return plot_part_of_daily_active_cases(geo_targa_covid_df, indicator)
    elif view == "line":
        return plot_daily_cumulative_active_cases(geo_targa_covid_df, indicator)
    else:
        return plot_race_plot_of_cumulative_daily_active_cases(
            geo_targa_covid_df, indicator
        )
Firstly, you should notice the order of the arguments of our function: view
then indicator. This order corresponds to the order in which we declared our
dependent inputs when calling @app.callback.
A Dash callback function takes only positional arguments whose order corresponds to the order of
Inputsandstatesalso but that’s another topic.
General application files
In callbacks.py we imported objects from two modules: data and plots.
I have created these two modules primarily to declutter the callbacks.py and
layouts.py files. But it is also a good practice following the
Don’t repeat
yourself Principle (DRY) as well
as
Separation of Concerns
(SoC). By using a
module where I include all the steps of data preparation, and another where I
include all the code necessary for generating my plots, I am avoiding creating a
huge cluster of code that is less maintainable and a headache to extend and / or
refactor.
To see how the data was prepared please refer to this notebook and to data.py
Parting thoughts
The creation of dashboards with a tool such as Plotly Dash is definitely much more involved that its WYSIWYG counterparts. However I found through my experience with making dashboards that with a correct assessment of the needs, choosing to code your own dashboard may prove a vastly more pleasurable experience both in creating and in maintaining it. As Abraham Maslow once wrote
If all you have is a hammer, everything looks like a nail1
Tools like Dash should not be used as a cure-all solution, but neither should Excel or Tableau. That is why the more tools in your toolbelts, the less effort you will spend hammering nails.
Further reading
- Official documentation on multi-page apps
- Practical Business Python - Creating Interactive Visualizations with Plotly’s Dash Framework (I recommend this blog in general not just this post)
- An awesome example of a more developed COVID-19 dashboard built with Plotly Dash